Drawdown simulator: what a run of losses costs
The drawdown simulator runs a hundred trades at a given win rate, risk and reward-to-risk ratio. The same strategy produces different outcomes — and that is its defining property, not an error in the model.
Calculating maximum drawdown over a run of trades
The starting capital in the model is ten thousand dollars. Each entry's outcome is decided by the win rate, and the size of a win by the reward-to-risk ratio you set. The run number makes the simulation reproducible: the same parameters and the same number give the same result.
The reward-to-risk ratio is shown ×10: a value of 15 means 1.5 — a winning trade makes one and a half times what a losing one loses.
What the simulator actually models
Four assumptions turn a strategy into a set of numbers. Knowing them, it is easy to tell what in the result comes from mathematics and what from luck.
Each trade wins with a given probability independently of the previous ones. Markets do not behave that way: losses tend to come in runs, because the strategy meets an unsuitable market regime. Real runs are longer than modelled ones.
an optimistic assumptionThe size is recalculated after each trade, so in a drawdown the losses in money shrink and in growth they expand. This is the standard sizing scheme, and it is what makes wiping out the account asymptotic rather than instant.
a percentage, not a fixed sumA value of 15 reads as 1.5 — the factor by which the average win exceeds the average loss. A pass has positive expectancy when the share of winning entries is above 1 ÷ (1 + R): at R = 1.5 that is 40 %, at R = 3 it takes 25 %.
the break-even boundaryThe checkbox turns on doubling the risk after every loss, resetting on a winning trade, while the “doubling limit” slider sets how many times in a row the risk manages to double: 4 means a 16-fold growth at most. Real martingale grids have no limit and reach a stop-out faster.
the limit is yours to setA run of losing trades in a row: why one strategy gives different outcomes
Scroll through several run numbers at the same parameters: the spread of final balances turns out wider than the difference between a “good” and a “bad” strategy. The cause is the length of losing runs, which over a hundred trades occurs as a matter of course.
| Losses in a row | At 50 % winners | At 40 % winners | What that means for the account at 2 % risk |
|---|---|---|---|
| 5 trades | 81 % | 94 % | around 10 % of the deposit |
| 6 trades | 55 % | 87 % | around 12 % of the deposit |
| 7 trades | 32 % | 69 % | around 13 % of the deposit |
| 8 trades | 17 % | 49 % | around 15 % of the deposit |
The probability of meeting at least one run of that length over 100 trades. Losses are estimated with the size recalculated from the current deposit, so they are smaller than risk simply multiplied by the run length.
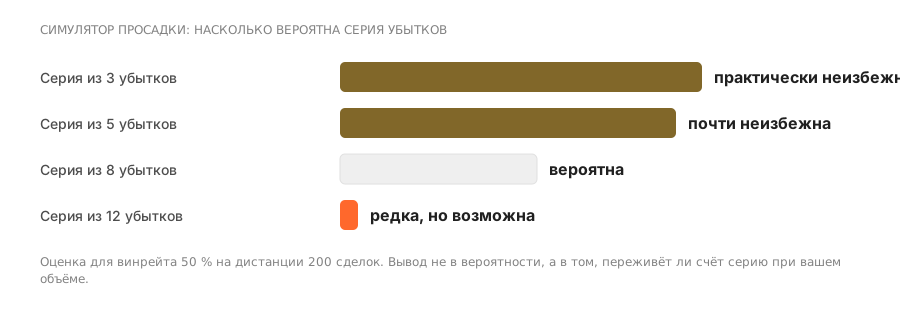
What follows from this. A run of six losses in a row at a 50 % win rate occurs in more than half of all simulations, and at a 40 % win rate almost always. The drawdown in a lead trader's card with a hundred trades of history has most likely simply not included such a run yet. That is not a sign of a good strategy but a sign of a short distance.
How to read the simulator's verdict
Frequently asked questions
Does the simulator account for fees and spread?
No. In the model each trade either delivers the set profit or loses the set risk. Real costs — spread, swap, the lead trader's fee — are deducted from the result on top, and over hundreds of trades they move the break-even point noticeably higher.
What drawdown is considered normal?
There is no universal threshold: it depends on how much you are prepared to sit through. A practical benchmark is the drawdown you would agree to see on the account without switching copying off. If the lead trader's historical drawdown is already larger than that number, the subscription does not suit you regardless of the return.
Why does the account still go negative with positive expectancy?
A positive expectancy describes the average result over an infinite distance. Over a hundred trades the dispersion outweighs the expectancy: a proportion of runs end in the red even for a profitable strategy. That is exactly why a test period is measured in months rather than weeks.
Does martingale always wipe out the deposit?
Not always — and that is its danger. Doubling after a loss wins in most runs and looks handsome in the statistics. The wipe-out comes once and in full, when the run of losses turns out longer than the deposit allows.
Why model a drawdown before subscribing?
To see the journey, not the destination. A strategy with a good annual return can pass through a fall along the way at which the subscriber switches off — and misses the recovery.
What is a losing run?
Several losses in a row. At a 50 % win rate a run of seven losses over a distance of two hundred trades is a likely event, not an exceptional one.
How do you compute the probability of a losing run?
The probability of a run of length n at a win rate of w is roughly (1−w) to the power n at each position, and over a long distance such runs are near-inevitable. The practical conclusion is simple: the question is not "will it happen" but "will the account survive it".
Why does martingale look profitable?
Because doubling the size after a loss returns the account to profit in most cases — until the one run the deposit cannot cover. Meanwhile every metric improves at once, which is what makes such accounts attractive on a showcase.
What drawdown kills a deposit?
Formally, the one after which margin runs out. In practice, the one at which the subscriber switches off. The second almost always arrives before the first.
Should costs be included in the simulation?
Without question. A strategy with a positive expectancy before costs often turns out to be loss-making after them, and the only way to see it is to put the spread and the fee into the calculation.
Read next
