Calculation methodology: what stands behind every figure
The calculation methodology on this site is simple: every figure is illustrative — it shows the mechanics rather than promising a result. Here we set out where the data comes from, which assumptions are built into the calculators and where the boundary of what we can verify lies.
Our rules for handling data
Every platform term — minimum deposit, fee, licence — comes with a source and a verification date. Where no check was made, an explicit note appears instead of a number.
no exceptionsFirst the platform's official site, regulator filings and the broker's contract specifications. Aggregators and reviews serve only as a prompt to double-check.
a hierarchy of sourcesThe calculators and examples use formulas with fixed assumptions. This is neither a forecast nor a guarantee: different inputs give a different result.
wherever there is a calculationRates and platform availability change. A verification date is shown on every page; material with an outdated date is updated or flagged.
a date on every pageWhat is built into the calculators
| Tool | What it calculates | Key assumptions |
|---|---|---|
| Size and risk per trade | The copied size, the loss at the stop and the risk as a percentage | A pip value of about $10 on a standard lot of a currency pair; size rounded up to the minimum lot |
| Return after fees | Final balance, net profit and average annual return | The fee is charged on profit under a high-water mark; a drawdown occurs once a year; the showcase is computed the same way but without fees |
| Fee models | The cost of a subscription, a success fee and a volume charge over a year | Turnover and return are entered manually; spread and swap are excluded and counted separately |
| Trade-series simulator | The equity curve and maximum drawdown | A pseudo-random series at the chosen win rate; fixed risk per trade, or doubling when martingale is enabled |
| Trader scoring | A candidate score from 0 to 100 | The criteria weights are set by the editorial team and described on the page itself; a martingale tell zeroes the score |
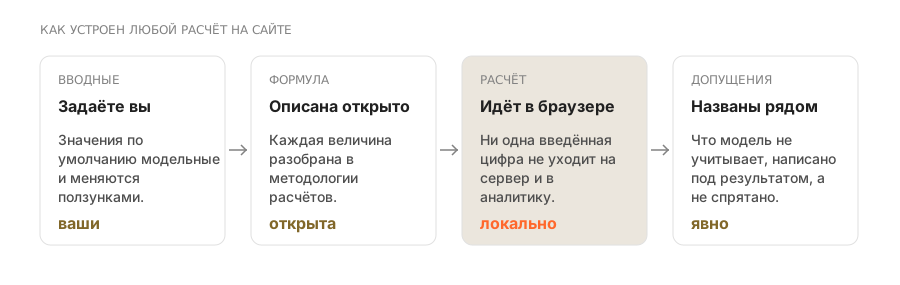
The formulas are deliberately simple and checkable: any calculation can be reproduced in a spreadsheet. We use no hidden coefficients and do not tune the result to fit a conclusion.
What we do not do
Frequently asked questions
Why do the calculator figures not match mine?
Because they are illustrative: an average pip value, spread and drawdown frequency are assumed. Enter your own values — the mechanics stay the same, the result changes.
How do you choose platforms to review?
By whether they offer copying, how accessible they are to our readers and how much interest there is in them. Placement in the catalogue is not for sale and does not depend on affiliate relationships.
What if you got the data wrong?
Write to us — the correction will be published with a note, as set out in our editorial policy. We do not quietly delete mistakes.
Where do the figures in your calculators come from?
The formulas are standard and described on this page, and the inputs are set by the user. The defaults are illustrative: their job is to show the mechanics of the calculation, not to predict your result.
Why does the result differ from the platform's own calculation?
Platforms often measure return against the deposit's lowest value over the period and without the subscriber's costs. We measure against the amount deposited and include costs — the figure comes out smaller and more honest.
Which assumptions are built into the calculations?
Pip value, slippage and the cap on doublings are sliders rather than being hard-wired into the model. The defaults correspond to a standard lot of a major currency pair.
Are taxes accounted for?
No. The tax rate depends on country and status, so the calculations are given before tax — you have to subtract it yourself.
Can your calculations be verified?
Yes: every formula is set out here, and the computation runs in the browser — you can see it in the page source. We do not ask you to take our word for it and we do not hide the mechanics.
What should you do if you find an error in a calculation?
Write through the form on the contacts page, naming the page and the disputed figure. We check the error against the primary source, correct the text and the calculations tied to it, and update the verification date.
Read next
