Currency pair correlation when copying trades
Currency pair correlation decides whether you hold a portfolio of several lead traders or one trade in four copies. We work out the real size of the position, allowing for links between instruments.
How much size you actually hold
Enter what your lead traders trade. The tool adds the sizes with correlation taken into account: same-direction trades on linked pairs add up, opposing ones cancel each other out.
Calculated on typical correlation coefficients and assuming the instruments have comparable volatility. The real size is the size in a single pair that would give the same spread of outcomes.
Which currency pairs correlate, and why
A currency pair is not a standalone instrument but a ratio of two currencies. When the same currency sits in several pairs, those pairs are linked mechanically, not by coincidence.
EURUSD, GBPUSD, AUDUSD and NZDUSD rise when the dollar weakens. Buying any two of them is one bet against the dollar, placed twice.
link +0.65…+0.90USDCHF, USDCAD and USDJPY move against the first group. Buying USDCHF while holding EURUSD is two opposite bets on the dollar.
link −0.60…−0.90AUDUSD and NZDUSD are the most tightly linked of all: commodity economies, similar monetary policy, a shared risk flow. In practice they are one instrument.
link +0.90XAUUSD is quoted in dollars and is therefore tied to the whole first group, but more loosely: the metal has its own demand as a safe haven.
link +0.30…+0.50A matrix of links between the main instruments
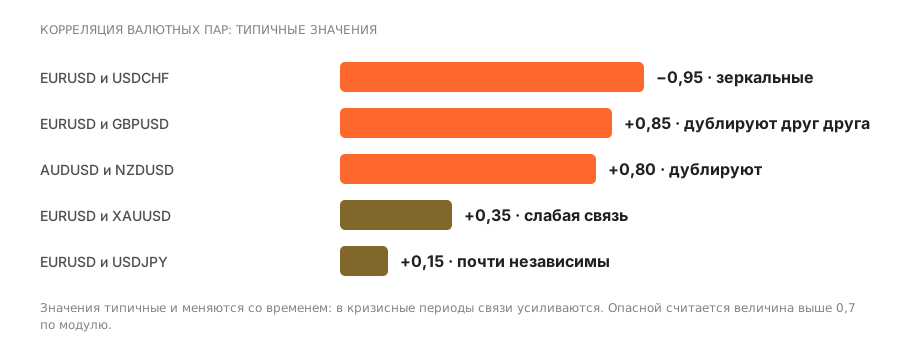
Typical values on daily data. A coefficient close to +1 means the instruments move together, close to −1 means they move against each other, near zero means independently.
| Tool | EURUSD | GBPUSD | USDJPY | USDCHF | AUDUSD | NZDUSD | USDCAD | XAUUSD |
|---|---|---|---|---|---|---|---|---|
| EURUSD | +1.00 | +0.85 | −0.35 | −0.90 | +0.70 | +0.65 | −0.65 | +0.40 |
| GBPUSD | +0.85 | +1.00 | −0.30 | −0.80 | +0.65 | +0.60 | −0.60 | +0.30 |
| USDJPY | −0.35 | −0.30 | +1.00 | +0.35 | −0.25 | −0.25 | +0.30 | −0.40 |
| USDCHF | −0.90 | −0.80 | +0.35 | +1.00 | −0.60 | −0.55 | +0.60 | −0.45 |
| AUDUSD | +0.70 | +0.65 | −0.25 | −0.60 | +1.00 | +0.90 | −0.60 | +0.50 |
| NZDUSD | +0.65 | +0.60 | −0.25 | −0.55 | +0.90 | +1.00 | −0.55 | +0.45 |
| USDCAD | −0.65 | −0.60 | +0.30 | +0.60 | −0.60 | −0.55 | +1.00 | −0.35 |
| XAUUSD | +0.40 | +0.30 | −0.40 | −0.45 | +0.50 | +0.45 | −0.35 | +1.00 |
Correlation is not a constant: in a calm market the links are weaker, in a crisis almost every pair starts moving together against the dollar. Check current values before you assemble a portfolio of subscriptions.
Diversification in copy trading: what correlation changes
Red flags of a portfolio of subscriptions
There is no portfolio
- Every leader trades one pair or one currency group
- Trades open at the same time of day on the same signal
- The lead traders' equity curves repeat each other's shape
- Last year's drawdowns fell on the same weeks
There is a portfolio
- Instruments from different groups: dollar pairs, crosses, metals
- Different horizons: intraday for one, position trading for another
- The leaders' drawdowns fall at different times
- The portfolio's real size is noticeably below the sum of the sizes
Frequently asked questions
How many instruments should a portfolio of subscriptions hold?
Count independent bets, not instruments. Four leaders on EURUSD, GBPUSD, AUDUSD and NZDUSD are one bet against the dollar, not four. Two leaders on EURUSD and USDJPY give more independence than five on dollar pairs.
Which currency pairs should a beginner choose?
It makes sense to start with one liquid pair such as EURUSD: it has the tightest spread, so copying costs the least. The question of which currency pairs a beginner should choose really comes down to another one: do not take a second subscription on a pair from the same group until you have seen the first one's drawdown.
Where can I get current correlation coefficients?
They are computed from historical quotes over a chosen period — analytics services and the platforms themselves publish such tables. The values on this page are typical: they show how the links are built, not today's market.
Does correlation remove the risk completely?
No. Opposite trades reduce the spread of outcomes but do not cancel the costs: you pay the spread, the swap and the leader's fee on every copy. A portfolio of opposite trades is a guaranteed loss on costs.
Why does diversification stop working in a crisis?
In moments of panic capital moves into the dollar and safe havens at once, and correlations jump towards one. A portfolio that looked spread out in a calm market behaves like a single position on such a day.
What is currency pair correlation in plain words?
A measure of how far two pairs move together. A value near +1 means almost identical movement, near −1 a mirror image, near zero independence.
Which currency pairs correlate most strongly?
Pairs sharing a currency: EURUSD and GBPUSD move alike, EURUSD and USDCHF almost as mirror images. That is precisely why subscriptions on such instruments give no diversification.
How does correlation affect a portfolio of subscriptions?
It turns several strategies into one position. Four subscriptions with a coefficient of 0.9 carry risk close to that of a single position at four times the size.
What correlation value counts as dangerous?
Above 0.7 in absolute terms the instruments effectively duplicate each other. Diversification starts to work at around 0.3 and below.
Does correlation change over time?
Constantly. In a calm market the links are weaker; in a crisis many assets start moving in step — exactly when diversification is needed most.
How do you build an uncorrelated portfolio of subscriptions?
Separate not only the instruments but the styles: an intraday strategy on European pairs and a medium-term one on metals are less linked than two intraday strategies on the same pairs.
Read next
