Copy trading return calculator
The copy trading return calculator works out what is left on the account after the lead trader's fee and the annual drawdown. The dashed line is the showcase; the solid line is the return after fees.
| Period | Showcase | Your account | Difference |
|---|
Lost to fees
The gap between the leader's advertised return and your result over the whole period: the fee on every profitable month plus the growth you never earned on the money taken away. The drawdown is identical in both lines — the gap comes from fees alone.
How the return calculation works
Four formulas that make up the result. The showcase and your account are computed by the same scheme — they diverge only on the lead trader's fee.
With reinvestment the account grows from its current amount: total = total × (1 + return). Without it, profit each month is computed on the starting deposit and does not compound — over a long horizon the difference between these two modes is larger than the difference between a good lead trader and a mediocre one.
toggle beneath the slidersCharged only on gains above the account's previous high — that is the high-water mark. After a drawdown the lead trader receives nothing until the account returns to its former peak: otherwise the same profit would be paid for twice.
only on new highsEvery twelfth month, minus the set percentage is substituted for the return. The drawdown is identical in both lines of the chart, so the gap between them is created purely by fees rather than by different luck.
hits both linesComputed as (total ÷ start) to the power of 12 ÷ months, minus one. It is the only figure comparable with a deposit account or a bond. If the account has gone to zero the value is undefined, and a dash appears instead of a number.
converts to annualWhere the gap between the showcase and your account goes
Defaults: 5,000 $, 3 % a month, three years, a 25 % fee, a 12 % drawdown a year, reinvestment on. Let us break the total into its parts.
| What we compute | Final balance | Annualised |
|---|---|---|
| The lead trader's showcase, before costs | $14,491 | 42.6 % |
| Minus a 25 % fee on profit | $11,139 | 30.6 % |
| Minus a 12 % drawdown once a year | $9,994 | 26.0 % |
| Both losses together — your account | $8,227 | 18.1 % |
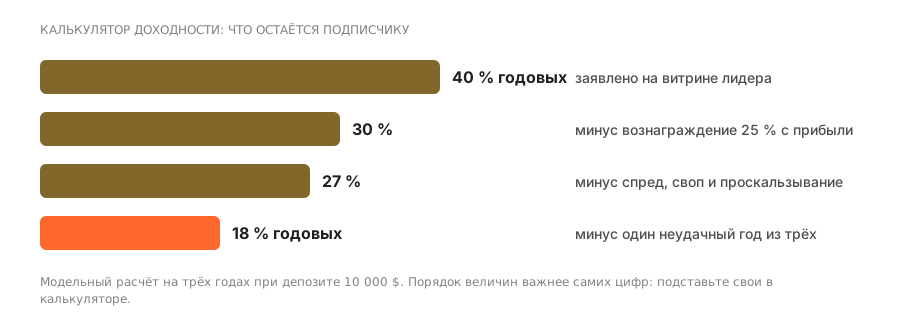
From this the main point is visible: 3 % a month is not 36 % a year but 42.6 % thanks to compounding; yet what reaches you is 18.1 %, meaning the fee and one annual drawdown consume about 70 % of the showcase return.
How much you can earn from copy trading: how to read the result
Four assumptions built into the calculation. Knowing them makes it easier to tell a model figure from a promise.
A reality check. Set the return to 10 % a month and the calculator will show a fantastical sum. That is precisely the arithmetic used in advertising. Sustained returns over distance are measured in single percentage points a month, not tens, and they come with drawdowns that advertising calculations leave out.
What this calculation does not account for
The model counts only the lead trader's fee. Four items stay outside it, and all four reduce the total.
Spread, swap and slippage are charged on every trade and do not depend on the outcome. On an active strategy they are comparable to the lead trader's fee — a separate fee calculator works them out.
depend on trade frequencyThe calculation covers only the share of profit. If the lead trader also charges a subscription per period or a turnover fee, they are added on top of the result and are charged in a losing year too.
add to the commissionThe model shows the result before tax. The rate and the payment procedure depend on your jurisdiction and on whether the platform acts as a withholding agent.
depends on jurisdictionIn the model every month is identical. A real curve consists of strong and weak periods, and the order in which they come changes the total when reinvesting: a loss at the start costs more than the same loss at the end.
the order of months mattersFrequently asked questions
Why is 3 % a month not 36 % a year?
With reinvestment the months multiply rather than add: 1.03 to the twelfth power gives 1.4258, that is 42.6 % a year. Compounding works both ways — it also enlarges the absolute size of a drawdown, because the same percentage fall takes more money off a grown account.
What eats more — the fee or the drawdown?
On the default values, roughly the same. With no drawdown but a 25 % fee the annualised figure is 30.6 %; with no fee but a 12 % drawdown it is 26.0 %. Together they pull the result down to 18.1 % against a showcase 42.6 %.
Why does "gain for the period" look so much larger than the annualised return?
Gain for the period is the cumulative total over the whole time, and it grows with the horizon: 64.5 % over three years. The annualised figure reduces that same result to a single year, and that is what you compare against alternatives. Marketing material usually shows the first number and stays quiet about the timeframe.
What should you enter if the lead trader charges a subscription rather than a share of profit?
Set the fee to zero and work out the annual subscription cost separately, in the fee calculator. Then subtract it from the net profit: on a small deposit a flat charge eats the result harder than a share of profit does.
How do you calculate copy trading returns in per cent per annum?
Divide the final amount by the starting one, take the root of the number of years and subtract one. Averaging yearly returns arithmetically overstates the result: it ignores that after a drawdown profit is earned on a smaller sum.
Why is my return lower than the lead trader's showcase?
The showcase shows their account's result. From yours the fee, spread, swap and slippage are deducted, and your entry happens at a different price. A gap of 10 to 15 percentage points a year is ordinary.
Is 5 % a month realistic?
Individual months can look like that; sustained over years, almost never. 5 % a month is around 80 % a year with compounding, and a strategy with that return carries a matching drawdown.
What matters more to the outcome: return or costs?
Over a short horizon, return; over a long one, costs. Two per cent of expenses a year over ten years consumes about a fifth of the final capital, whatever the return was.
How do you account for a bad year in the calculation?
Put it into the model directly rather than averaging it away. One year at minus 20 % among five profitable ones lowers the annualised return far more than it first appears.
Should return be measured against the amount deposited or the current one?
Against the amount deposited if you want the result of your investment, and against the current one if you are judging management quality. Platform showcases more often display the second figure: it looks better.
Read next
