How to choose a trader to copy
How to choose a trader to copy: if you sort a copy-trading leaderboard by return, the top rows will be filled with accounts you must not copy. Below is an interactive scoring tool: enter a candidate's metrics and check whether they pass the risk screen.
Candidate scoring: reducing a card to a single number
The eight filters below cut on one feature at a time. Scoring pulls them into a single assessment: six parameters from any service's card give a score and a verdict.
Three candidates from a leaderboard: what it looks like in numbers
The cards are built from typical profiles found in any leaderboard. The figures are illustrative and the accounts are not real — they exist to show how the same selection rules play out against concrete metrics. Press "send to scoring" and the calculator above will re-run the candidate.
This profile takes the first rows of a leaderboard sorted by return. It scores 22 out of 100: four months is not statistics, it is one lucky quarter, and a follower will not sit through a 46% drawdown.
Load into the scoreSix metrics out of seven give 93 points out of 100 — and that is the typical portrait of a martingale: it lifts the profit factor, hides the drawdown and adds trades. The seventh line zeroes the result.
Load into the scoreNot a single outstanding figure: a modest profit factor, a noticeable drawdown — but a long history, plenty of trades and verified statistics. This is the candidate for a test subscription.
Load into the scoreWhat these three cards show. The first candidate is eliminated by arithmetic: a short history and a drawdown a subscriber would not survive. The second clears every metric with room to spare and is still rejected: martingale does not spoil the figures, it improves them, so a smooth curve only means the long losing run has not happened yet. The third wins by being dull: a moderate return, but a repeatable one.
Screening criteria: from the showcase to a trial subscription
Eight filters in descending order of severity. The first eliminates most of the top of the ranking; the last costs money, which is why it comes last.
Less than six months of history or fewer than fifty trades means there is no statistics, only chance.
eliminates the mostLook at equity drawdown, not balance drawdown: the former includes the floating loss on open positions. The gap between them is exactly what the leader is sitting out.
the main cutA smooth balance curve next to a collapsed equity curve is the signature of sitting on losses: every closed trade is a winner, the loss hangs in the open ones. Compare the two charts instead of admiring one.
catches martingaleFind the days of sharp market moves on the chart and see what the account did: cut the loss, or added size against the move.
requires manual workWhether the trades are confirmed independently of the leader's claims. An unverifiable history is a promise, not a fact, however pretty the chart.
verified externallyWhether the leader's account is live or a demo, and how they get paid. The share of a manager's own capital is shown explicitly only by PAMM accounts; a fixed subscription is paid to them in a losing month too, while a share of the profit rewards taking more risk than they would take themselves.
the leader's incentivesWork out the full annual price for your own deposit: subscription, profit share, turnover commission and spread. On a modest return the costs swallow the entire result.
calculate it in advanceTwo or three months at minimum size. The goal is not to earn but to see the real gap between your result and the showcase.
costs moneyTrader red flags
Reject immediately
- Returns of several hundred per cent within a few months
- A curve with no drawdown at all alongside a high return
- A sharp jump in size after a losing trade is a martingale; many opposing positions on one pair is averaging down
- The history is cropped: only the last few good weeks are shown
- The leader promises a result or guarantees income
Check further
- Few trades over a long period — a rare-entry strategy with too little data
- All the profit came in one month, with the rest flat
- An abrupt change of instruments or style mid-history
- The balance drawdown is near zero while the equity drawdown is double-digit — losses are not closed, they are sat on
- The leader has none of their own money in the account
A practical rule. The best candidate by this method is not the most profitable but the most predictable: moderate return, controlled drawdown, a long history and trade logic you can follow. Compare them at equal risk — by the ratio of return to drawdown. The dull account usually wins not on its own merits but because an aggressive one cannot be scaled down on a small deposit: copying hits the minimum lot, and you get its risk rather than yours.
Frequently asked questions
How many traders should you copy at once?
Three to five, but the upper bound is set by lot arithmetic, not by appetite: if one leader is left with a share where copying hits the minimum 0.01 lot or skips part of the trades, you need fewer subscriptions. With a sufficient deposit, low correlation matters more than the count: different instruments, timeframes and approaches.
What to do if the leader goes into drawdown?
Compare the current drawdown with the historical maximum. If it is within the range usual for this account, that is the strategy working as designed. Set the switch-off threshold in money and set it in advance, before subscribing: the historical maximum is eventually broken on any account, and deciding at the bottom of a drawdown means locking in the loss at the worst point.
Does verified statistics help?
It confirms that the trades are real and were made on the stated account. But it does not stop a leader running ten accounts and showing the one that worked, so look at the track record and trade count as well.
How do you choose a trader to copy?
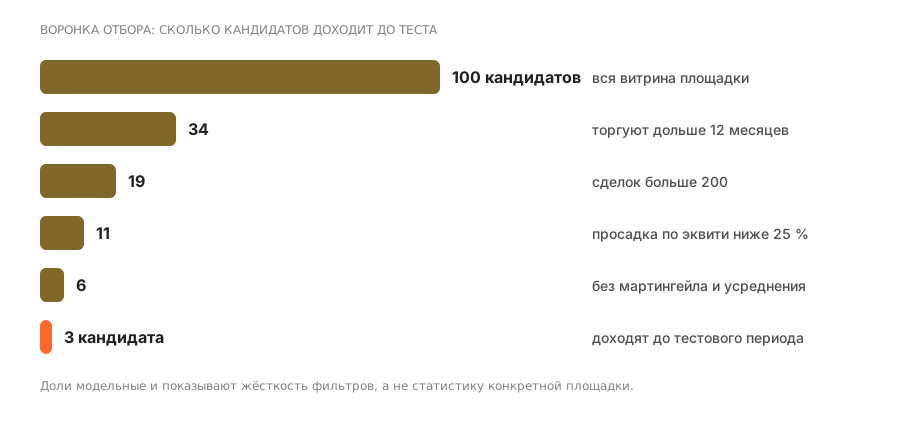
By eliminating, in order, everyone who fails on track record, trade count, drawdown and the presence of martingale. Out of a hundred candidates on a showcase, usually only a handful reach the test period — and that is a normal outcome for a screen.
What should you look at first?
At the length of the track record and the number of trades. While those are small, any attractive return is a lucky spell rather than a property of the strategy.
Should you pick a trader from the top of the leaderboard?
The top usually reflects recent return or subscriber count. Both describe the past; you still have to verify against the metrics.
How much money should one trader get?
Enough that their worst historical drawdown, happening to you, would not force you to switch off. Usually that is a share of the deposit, not all of it.
How long should a lead trader be tested?
At least two to three months and at least several dozen trades, so that you see both their losing runs and the actual cost of copying on your own account.
When should a trader be switched off?
When the character of the trading changes — sizes grow, trades become more frequent, adding to losers appears — or when the drawdown passes the boundary you set before subscribing. A drawdown within the historical norm is not a reason.
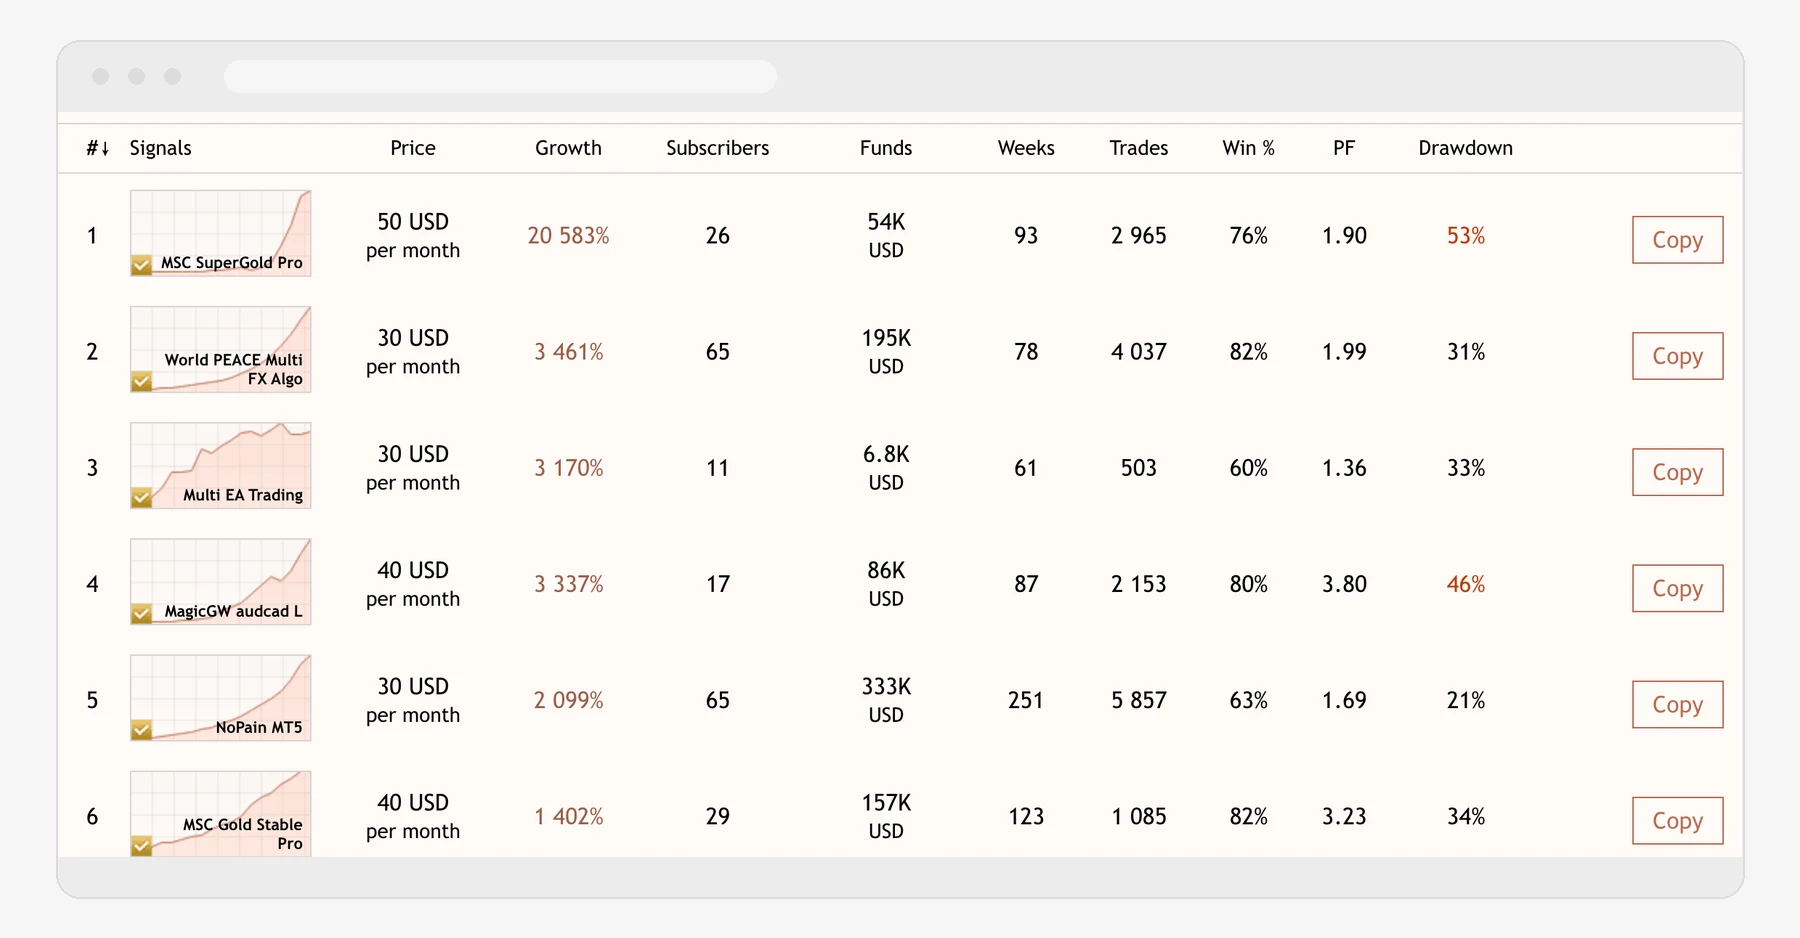
The platform's public page as captured: the interface and data are real but they change. Colours mapped to the site palette, avatars blurred.
Read next
