A trader's calculator for copy trading
There is more than one trader's calculator here: nine tools work out position size and risk per trade, the full cost of a subscription for a year, a candidate's score, the drawdown of a losing run and portfolio correlation.
A lot size calculator and eight other tools
All calculations run right in your browser; nothing is sent anywhere. Enter your own figures — the illustrative defaults are only there to give you a starting point.
Which calculator answers which question
The tools do not replace one another: each closes one fork where subscribers usually go wrong. The table is here so that you do not have to open all nine in turn.
| Tool | The question it answers | What you need to enter | What you get |
|---|---|---|---|
| Size and risk | What size will the trade open at for me, and will the account survive a losing run | Deposit, lead trader's lot, copying mode, stop in pips | Your size, risk per trade in per cent, and what is left after ten losses in a row |
| Return | What will be left of the lead trader's stated percentages on my account | Deposit, lead trader's return, fee, term, costs | The account total by year and the actual return after all deductions |
| Fees | Which fee model is cheaper at my particular deposit | Deposit, return, subscription rate, share of profit, turnover | Three models in money for a year and the difference between them |
| The trade's path | Why my entry price differs from the lead trader's | Platform and broker latency, spread, slippage, size | The gap in pips and money for each of the three legs |
| Candidate scoring | Whether this trader is worth a test period | Six metrics from the card: track record, trades, drawdown, profit factor, win rate, martingale | A score out of a hundred and a verdict: test, watch or reject |
| Metric scale | Whether my metric value is normal or already bad | One number for any of the six metrics | The risk zone, and which neighbouring figure devalues this one |
| Drawdown simulator | What the drawdown looks like on the strategy I am about to copy | Win rate, risk per trade, number of trades, martingale and the cap on doublings | The account curve, the maximum drawdown and the outcome of the run |
| Portfolio correlation | Whether my four subscriptions are a portfolio or one trade at four times the size | Instruments and shares for each lead trader | A matrix of links and the actual size of the combined risk |
| Glossary of terms | What a word from the subscription terms means | A search query against the list | The term's definition and the concepts related to it |
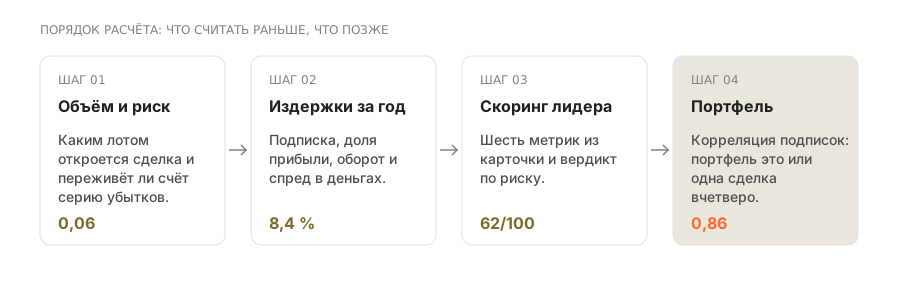
The order in the table matches the order of calculation: size first, then money, then the choice of lead trader and the portfolio's composition.
Three mistakes that make a calculation diverge from reality
The formulas themselves are simple; the mistakes are usually in the inputs. Three cases occur more often than the rest.
How each figure is computed and which assumptions apply is set out in the calculation methodology.
Copy trading calculator: where to start counting
The order in which these tools make sense: size first, then costs, and only then the choice of lead trader.
Until you know what lot your trade will open at, the rest of the arithmetic is meaningless. Start with the size and risk calculator.
size and risk →Subscription, share of profit, per-volume charge and spread. At a modest return they eat the whole result.
fees →Six metrics from the lead trader's card and a verdict on risk. Martingale zeroes the result regardless of the other figures.
scoring →Several subscriptions are a portfolio only at low correlation. Otherwise it is one trade in several copies.
correlation →Frequently asked questions
Is data from the calculators sent anywhere?
No. All calculations run in your browser in JavaScript; the server only supplies the page file. We do not collect the figures you enter and do not ask for registration.
Where do the default values come from?
They are model figures chosen so that the result is illustrative: a typical deposit, a typical lot for a lead trader, typical costs. Replace them with your own — the relationships in the calculations are linear and transparent.
How accurate is the cost calculation?
It is as accurate as the inputs you supply. The quantities that used to be hard-wired into the model are now sliders: pip value, entry slippage and the martingale doubling limit. The defaults match a standard lot of a major currency pair.
Can a trader be chosen from these calculations?
The calculations show risk and costs but do not replace checking the history. Scoring covers four filters out of eight: the shape of the curve, behaviour in stress periods and the test period are worked out by hand.
Which calculator do you need before your first subscription?
The size and risk calculator. Until you know what lot the lead trader's deal will open at for you, the other calculations have nothing to stand on.
Do you need to register in order to calculate?
No. There is no registration at all: every calculation runs in the browser, and the figures you enter are sent nowhere.
Do the calculators work on a phone?
Yes, all nine are adapted to a narrow screen. Sliders and tables behave on mobile exactly as they do on desktop.
Can a calculation be saved or shared?
There is no separate save function, but a link to the page plus your own inputs reproduces the calculation by hand in seconds — the formulas are transparent and set out in the methodology.
Do these calculations suit crypto and stocks?
The mechanics are the same, but the pip value and the costs differ: they have to be taken from your own instrument's specification. The defaults assume a major currency pair.
Why do the calculators give no "copy or not" verdict?
Because such a verdict would be personal investment advice. The calculations show risk and costs; the decision stays with you.
Read next
