Trader metrics: what each figure means
Trader metrics are the six numbers used to filter candidates. Pick a metric, enter the value from the trader's card, and see which zone it falls into and how that particular number gets gamed.
Maximum drawdown and the shape of the curve
An equity curve shows how the account changed over time. The slope is the return; the shape is the risk, and it is the shape that separates a working strategy from a time bomb. In forex a smooth curve most often means averaging down on major pairs: positions are held until a reversal rather than cut at a stop.
In what order to read a trader's card
The metrics on a card are arranged the way the platform finds convenient, not the way they should be checked. The order below eliminates most candidates in the first two steps, without wasting time on the rest.
Read first, because it devalues everything else. Four months and eighty trades is not statistics but one lucky quarter: any pretty figures next to them mean nothing.
eliminates most of themThe number does not read without the picture. The same 9 % drawdown occurs on a strategy with stops and on a grid that holds a loss until the reversal — the second is dangerous exactly to the degree it looks calmer.
the number plus the chartOnly now does it make sense to look at the economics of the trades. A high win rate with a profit factor near one means the rare losses are enormous — and that shows only when the two numbers are compared.
only togetherThe source is checked last: does the platform calculate the metrics from the trading account, or show what the lead trader entered themselves. An unverifiable card sends you back to step one.
otherwise none of the above countsWhat a card never contains
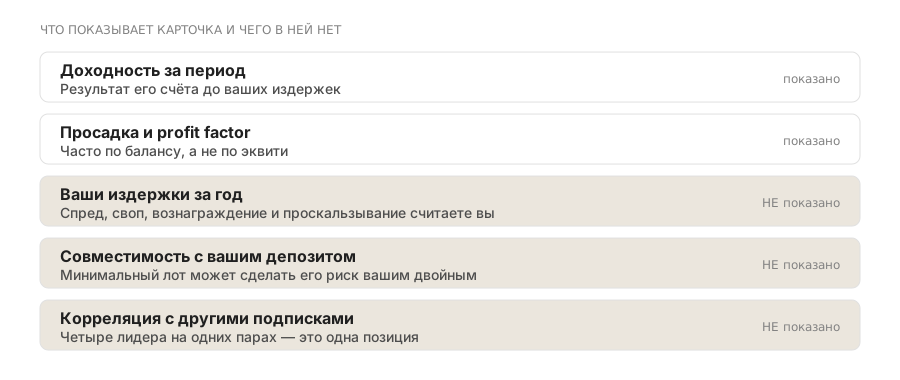
Four things determine your result, yet no platform shows them on its display. They are worked out by hand or not at all — and in the second case the divergence comes as a surprise.
Your broker's spread and swap, the platform's commission, slippage during copying. The return in the card was computed on the lead trader's account, where none of that exists.
counted separatelyThe card does not know that on your account the size will have to be rounded to the minimum lot. A strategy that is excellent for a deposit of tens of thousands can be unusable for one thousand.
depends on youEach lead trader's metrics are shown in isolation. Five subscriptions on one currency group carry the risk of a single position, but no card says so.
visible only on the portfolioThe display describes the past. A change of instruments, a growth in size or new entry logic will appear in the metrics months later — and on your account tomorrow.
lags by monthsHow the metrics are read together
No single number works on its own. Screening happens in pairs — and almost every dangerous account is caught by a contradiction between two metrics.
| Pair | What it means | Verdict |
|---|---|---|
| High win rate + low profit factor | Many small wins and rare huge losses — classic averaging | Reject |
| High return + drawdown above 40 % | The result came from aggressive risk, not from a system | Only with a small slice of capital |
| Long track record + few trades | A rare-entry strategy: even years do not give enough data | Keep watching |
| Good recovery factor + less than a year of history | There has been no major drawdown yet, so the denominator is understated | Do not trust the number |
| A smooth curve plus a drawdown by equity twice the balance figure | Losses are not taken but sat out | Reject |
Frequently asked questions
Which metrics should you look at first?
Track record and number of trades. They devalue everything else: at four months and eighty trades any attractive return is a lucky quarter rather than a property of the strategy.
Can showcase metrics be trusted?
Only if they are computed from the trading account rather than entered by the lead trader by hand. There is one way to verify: reconcile the stated figures against an exported trade history and recompute the drawdown yourself.
Why can a trader with perfect metrics still carry high risk?
Because some techniques improve every indicator at once. Doubling size after a loss lifts the profit factor, hides the drawdown and adds trades — on paper such an account looks better than a careful one.
What is never in a trader's card?
Your costs, the strategy's compatibility with the size of your deposit, its correlation with your other subscriptions, and what the lead trader is doing right now. All four determine the outcome, and all four are computed by hand.
How do you read a trader's statistics on a showcase?
Bottom-up: track record and trade count first, then drawdown, then return. Showcases are laid out the other way round — return at the top, because return is what sells.
What is the Sharpe ratio and do you need it?
The ratio of return to its variability: the higher it is, the smoother the earnings. Useful for comparison, but on short histories it is easily inflated and therefore secondary to track record and drawdown.
How many trades should a history contain?
Two hundred and up, so that the statistics stop describing chance. At twenty trades even perfect figures are indistinguishable from luck.
What does average trade duration tell you?
It tells you what you will be paying with: short trades pay through spread and slippage, long ones through swap. A strategy holding for several days spends more on swap than on the lead trader's fee.
How do you tell a good equity curve from a drawn one?
A good one has steps and setbacks; a drawn one rises in an almost straight line. The absence of drawdowns over a long history is not a sign of mastery but a sign that losses are not being taken.
Can metrics from different platforms be compared?
With care: platforms compute return and drawdown under different rules and over different periods. Only figures you have recomputed yourself, by one method, from an exported trade history are comparable.
Read next
