What drawdown is considered normal: a scale of trader metrics
What drawdown is considered normal, what profit factor is good and what a win rate means — the scale shows which zone a specific number from the card falls into and how that indicator is massaged.
The scale: put in a value from the trader's card
Pick an indicator on the left and enter the value from the candidate's card. The marker on the scale shows the zone; below it, what that number actually means and by what trick it is improved without changing the strategy.
Maximum drawdown
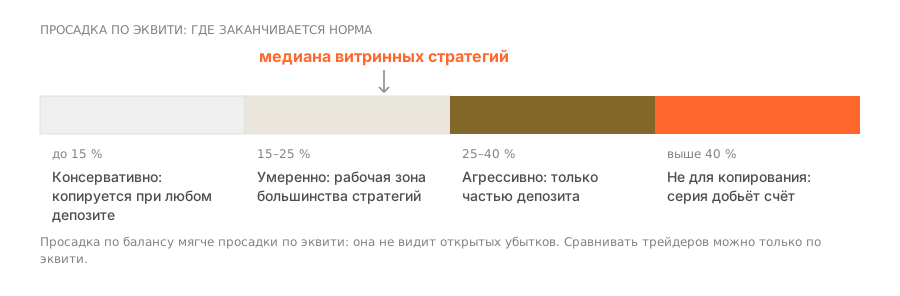
The worst fall from peak to trough across the whole history. The only metric that shows what you will feel on your own deposit. What you need is drawdown by equity, not by balance: in forex the difference between them is unclosed positions the lead trader is sitting out in the hope of a reversal.
Profit factor
The sum of all profits divided by the sum of all losses. A value of 1.0 means the account is flat. It shows the margin of safety: how many times the wins cover the losses.
Win rate
The share of winning trades. On its own it means nothing: it has to be read alongside the ratio of average win to average loss. A high win rate with a low profit factor is a direct sign that the rare losses are enormous.
Track record length
How many months the account has traded publicly. It matters separately from the number of trades: an account has to live through different market regimes — trend, range, a volatility spike.
Number of trades
The sample size. Below fifty trades any result is chance; from a hundred statistics appear; from three hundred you can speak of a pattern. In forex, allow for style: a scalper racks up three hundred trades in a month, a medium-term trader in two years.
Recovery factor
Net profit divided by maximum drawdown. It answers whether the strategy repays its risk: how much was earned per unit of the fall endured.
How it is massaged. The showcase displays drawdown by balance instead of equity: the floating loss of unclosed positions never enters it, and an account that sits out losses looks calm.
How it is massaged. Profit factor is computed on a trimmed history — starting after a big losing run. Check the calculation period against the account's opening date.
How it is massaged. Profitable trades are closed in small parts — each partial close enters the statistics as a separate winning trade.
How it is massaged. A dozen accounts are run in parallel and only the survivor is published — it has an honest long history, but it survived by chance.
How it is massaged. Grid strategies on major pairs rack up hundreds of trades in weeks: the number is large, but there are almost no independent decisions behind it.
How it is massaged. It grows by itself over time in a calm market: if a large drawdown has not happened yet, the denominator is understated.
Boundaries of trader metrics: why an indicator in isolation means nothing
Every indicator only reads in a pair with another. Five combinations in which a good-looking figure means the opposite.
A win rate of 90 % without the second number means nothing: a strategy can close nine trades at two dollars and the tenth at a hundred. The reverse holds too: 35 % winners at R = 3 gives a steady plus.
read togetherA profit factor of 2.40 over twenty trades is noise. The same figure over four hundred is a characteristic of the strategy. Without the sample size the ratio cannot be interpreted.
needs distanceA drawdown of 8 % over four months is not low risk but a short history. A maximum grows with time by definition: for any strategy it is larger over two years than over a quarter.
the maximum growsLead traders can only be compared by return at comparable drawdown. The same result achieved with twice the risk is not the same strategy but leverage on it.
one axis is meaninglessHow to read the zones on the scale
Frequently asked questions
What profit factor is considered good?
From 1.30 the figure leaves room for costs, from 1.60 the room is substantial. Values above 2.50 on forex more often mean a short history or losses held without a stop than an outstanding strategy: check the number of trades and the shape of the curve.
What is a normal win rate for a trader?
On its own — any. A trend strategy lives with 35 % winners, scalping with 70 %. What has to be assessed is the product: win rate × average win against the share of losses × average loss. That is exactly what profit factor is.
Maximum drawdown on equity or on balance?
On equity: it accounts for the floating loss of open positions. On a strategy that sits through losses, the balance drawdown looks like zero right up to the moment positions are closed.
Can the metrics in a platform's card be trusted?
Only if the platform calculates them from the trading account rather than from data the lead trader enters themselves. There is one way to check: match the stated figures against the exported trade history and recalculate the drawdown yourself.
What drawdown is normal in copying?
Up to 25 % by equity is the working range. Above 40 % the strategy relies on its author's patience rather than a subscriber's: almost nobody manages to sit through such a drawdown on someone else's trades.
Is a profit factor of 1.5 good?
That is solid, if computed over a long history without martingale. On a short track record, or with sizes growing after losses, the same figure means nothing.
Why is a 90 % win rate a warning sign?
Because it is usually achieved not by accurate entries but by keeping losing positions open. Such an account looks flawless right up to the one losing run that closes it.
How do win rate and the profit-to-loss ratio relate?
Inversely: a strategy with a 40 % win rate works if the average win is twice the average loss. Looking at one figure without the other is pointless.
What is the recovery factor?
The ratio of total profit to maximum drawdown. It shows whether the strategy repays the depth of fall it asks you to endure.
Which metric values are a stop signal?
A track record under six months, fewer than a hundred trades, drawdown by equity above 40 %, or any sign of martingale. Any one of the four is enough not to bother with the remaining figures.
Read next
